Результаты исследования обучающихся в проекте Youth in modern society
Содержание
Авторы и участники проекта
Участники группы "Hobby Hunters"
Тема исследования группы
Young people, how they spend their time and how that can affect them and society.
Проблемный вопрос (вопрос для исследования)
What are the most common leisure activities and hobbies among young people today?
Какие наиболее распространенные виды досуга и хобби среди молодежи сегодня?
Гипотеза исследования
We believe that most teens spend their time on the internet. Not necessarily wasting it, however, as they might still be spending it on developing usefull skills such as programming or attending online courses.
Цели исследования
Create a survey.
Conduct the survey among peers to gather data.
Present the results.
Результаты проведённого исследования
We created a survey using Google Forms after thinking over the questions that will be needed to gather the necessary data.Survey
Here are the results of the survey: The first part of our survey was obviously gathering data such as age and gender to see if correlations between certain hobbies and age/gender may exist.
The age groups we were targeting are 15-25.
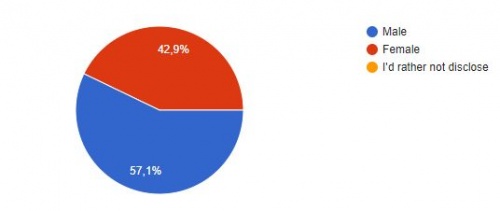
We tried to gather fairly equal amound of respondents of both genders to get a better perspective. The option to not reveal gender was given for people whose hobby might be not entirely socially acceptable for their gender. (For example, even to this day some boys face bullying for going to dance classes.)
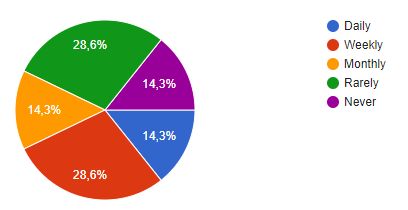
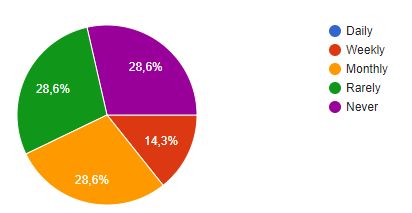
Now, the main point of our survey - hobby data. The data was a bit more surprising than we had expected it to be. We expected a lesser amount of young people who read in their spare time. That was a very nice surprise.
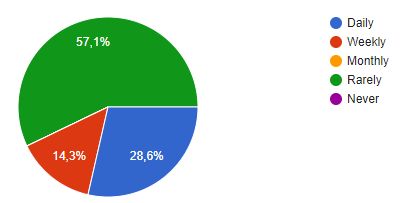
Yet another surprising revelation. We were aware that movies and tv shows aren't as popular as they used to be but we still didn't expect that over a half of our respondents would say that they rarely watch them.
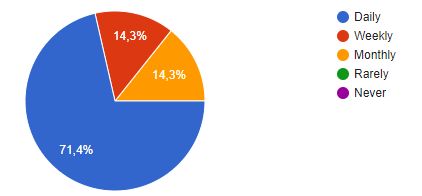
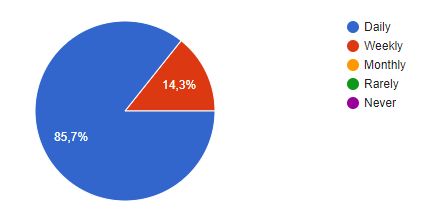
This is the first section that did not surprise us at all. Gaming is an ever-growing form of entertainment after all.
Sport diagram is almost exactly like we expected it to be. We did expect to see a slightly bigger amount of people who regularly exercise.
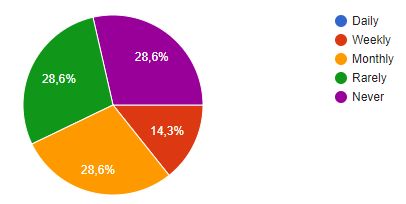
The next diagram was a very surprising match for the two next questions. The exact same ratio of people listen to music reularly and spend frequent social media pages.
This diagram is meant to represent how many young people pursue creative hobbies such as painting, music, photography, etc.
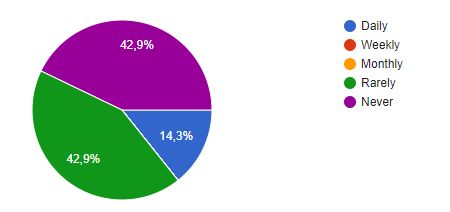
This diagram is about young people who might be tired of the stuffy city. It is unfortunate that most of our respondents indicate that youth doen't like leaving the comfort of modern world behind.
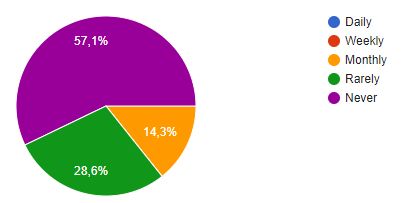
To see that nobody cooks as a hobby more often than once a month was quite a shock for our group. We certainly expected more respondents (especially in their 20s) to be interested in cooking.
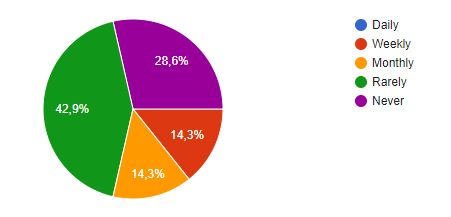
And at last - traveling. There were honestly a lot more traveling souls than we expected.
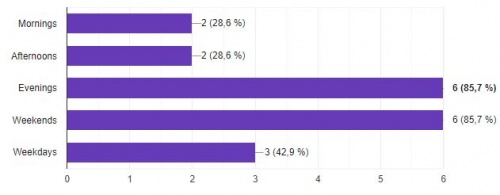
And lastly, we wanted to gather data on the times of the day and days of the week when our respondents would partake in their hobbies.

